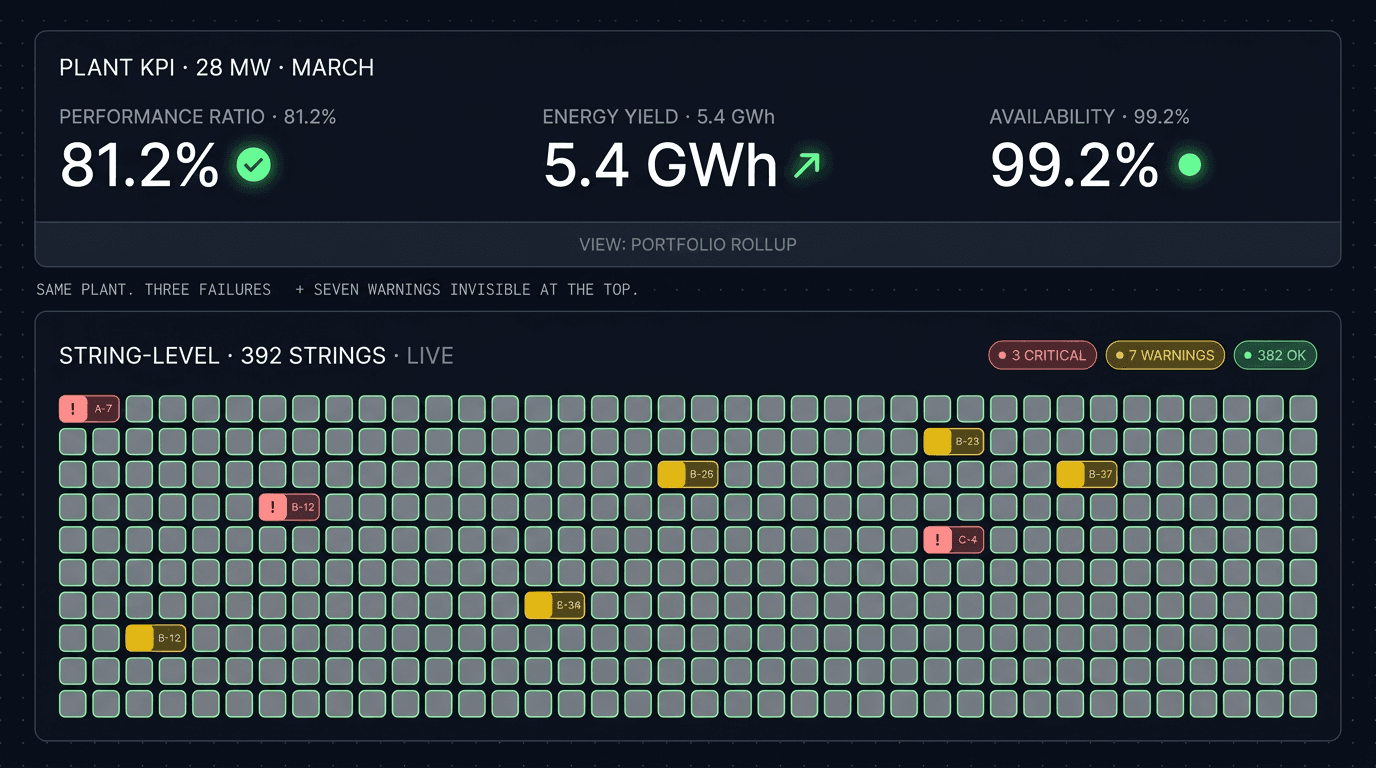
A 28 MW solar plant in the Vardar valley produced 5.4 GWh in March. The monthly performance ratio came in at 81.2%, marginally below the 82.0% guarantee. The asset manager flagged it as a slow month, requested an O&M review, and moved on. The investor pack referenced "slightly below-target performance" and a "weather-adjusted reconciliation" footnote that nobody asked about.
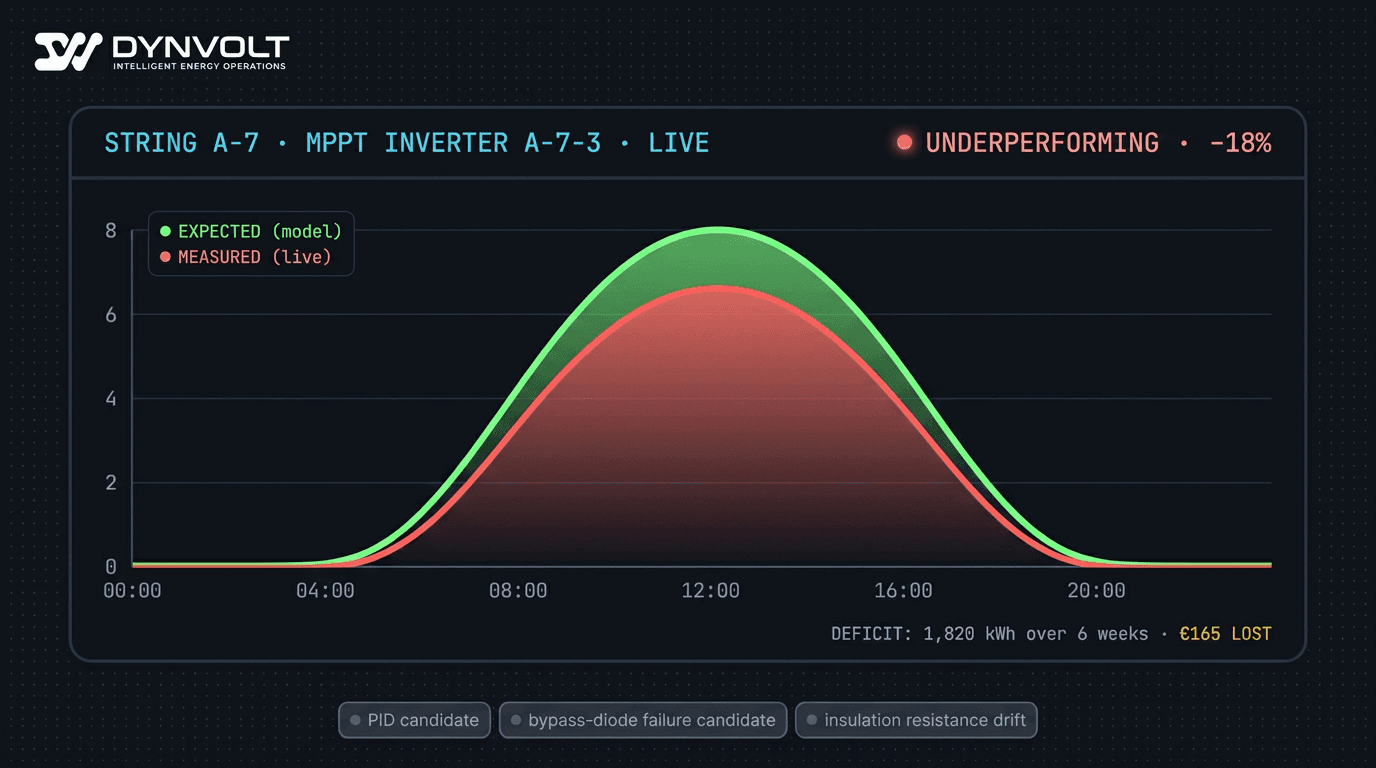
What the monthly KPI missed: one string on inverter A-7 had been producing 18% below its siblings since the second week of February. The bypass diode on the third module in that string had failed during a thermal cycle, and the string had been quietly shorting around the affected modules for six weeks. Total energy loss attributable to that single failure: about 1,820 kWh, or roughly €165 — too small to move the monthly PR materially, large enough to compound to €2,000+ over the year if undetected.
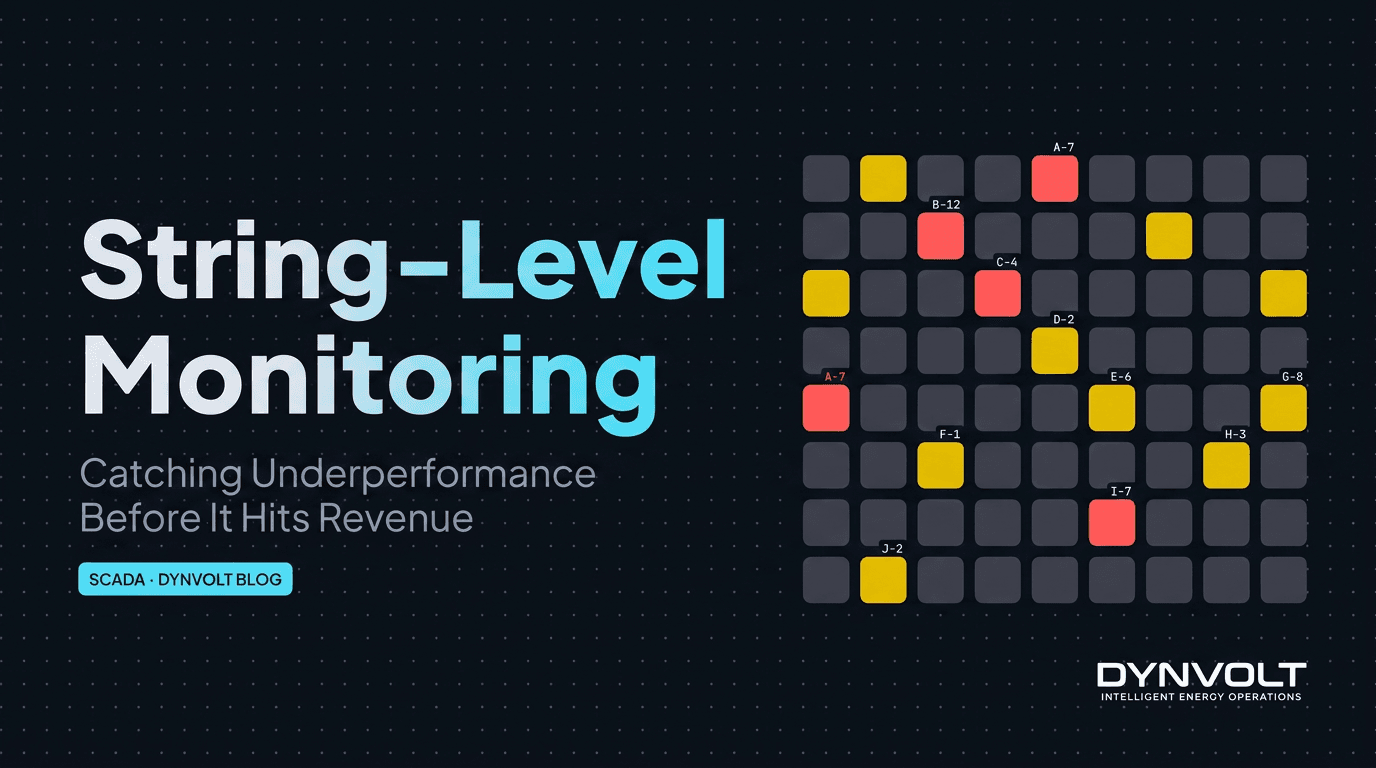
This is why string-level monitoring exists, and why plant-level KPIs alone hide the four most expensive fault modes in utility-scale PV. This guide walks through what those fault modes look like at the string, why they are invisible at the rollup level, and the revenue math that justifies the additional monitoring layer.
- Plant-level KPIs (performance ratio, capacity factor) average out string-level losses — a failing string typically loses 5–25% of its own output while moving the plant PR by less than 0.3 percentage points.
- The four highest-impact PV fault modes — PID, soiling, bypass-diode failure, ground faults — all manifest first at the string and only become plant-visible weeks later.
- Real-time peer-group comparison is the standard detection approach in serious monitoring platforms — comparing each string against the cohort that should behave identically under the same conditions.
- A single 18% string underperformance on a 5 MW plant compounds to roughly €1,800–2,400/year of lost revenue per string, well above the marginal monitoring cost.
- Per-string DC current and voltage are the two telemetry channels that matter — without them, every fault diagnosis is a guess against the inverter-level aggregate.
Why Plant-Level KPIs Lie
The performance ratio (PR) is the standard solar plant KPI defined by IEC 61724-1 — actual energy yield divided by theoretical yield given measured irradiance and temperature. It is the right metric for lender reports, insurance reviews, and quarterly investor summaries. It is the wrong metric for catching failures.
The reason is averaging. A 5 MW plant typically has 300–600 strings. If one string is producing 20% below its siblings, the contribution to the plant-level PR depends on the ratio of that string to the plant:
- 1 of 400 strings underperforming by 20% → plant PR shift of approximately 0.05 percentage points
- 5 of 400 strings underperforming by 20% → plant PR shift of 0.25 percentage points
- 20 of 400 strings (5% of the plant) underperforming by 20% → plant PR shift of 1.0 percentage points
A plant that is otherwise hitting its PR guarantee can have 20+ failing strings before the headline KPI moves enough to trigger a review. Those 20 strings, however, are producing 20% less revenue each — and that revenue loss is real and compounding daily.
The same applies to capacity factor, specific yield, and weather-adjusted PR. Every plant-level metric averages over the string population. The faults live in the tails of that distribution, where averages don't help.
The Four Fault Modes That Only Show Up at the String
Potential-Induced Degradation (PID)
PID occurs when high voltage between the panel frame (grounded) and the solar cells creates ion migration in the panel laminate. The result is reduced cell shunt resistance, lower open-circuit voltage, and gradually declining string output. PID is most common in n-type cells under hot and humid conditions, typically affects panels closest to the grounded end of a string first, and develops over weeks to months.
At the plant level, PID looks like a gradual drop in PR that could be soiling, panel aging, or seasonal drift. At the string level, PID looks like one string in a sibling group consistently producing 5–15% less than the others, growing over time, with the deficit more pronounced under high-irradiance conditions.
Soiling
Soiling is the accumulation of dust, pollen, bird droppings, or industrial particulate on the panel surface. It is the largest controllable energy loss in most utility-scale plants — typically 1–8% of annual energy in continental climates, higher in arid or polluted regions.
At the plant level, soiling is detected via a soiling station with a clean reference panel and a dirty production panel. The plant-wide estimate is a single multiplier applied uniformly. At the string level, soiling is heterogeneous — strings near a dirt road, downwind of agricultural fields, or under bird perches accumulate faster. String-level comparison flags which strings the cleaning programme should prioritise.
Bypass-Diode Failure
Modern PV modules have 3 bypass diodes per panel that short-circuit a sub-string when one cell in that sub-string is shaded or damaged. When a bypass diode fails open or fails short, the panel's behaviour under partial-load conditions changes — typically reducing output by 5–25% and creating thermal hotspots that accelerate further damage.
At the plant level, bypass-diode failure is invisible until enough panels are affected to move the inverter-level output measurably. At the string level, the affected panel's signature is a step-change reduction in string output at specific times of day (when shading or partial-cell conditions trigger the diode) and unusual I-V curve shape compared to siblings.
Ground Faults
A ground fault occurs when the DC circuit develops insulation failure to ground — typically from rodent damage to cabling, water ingress in a junction box, or cable insulation breakdown from UV exposure. Ground faults are safety events as well as energy events — sustained ground faults are a fire risk in dry conditions and can cause inverter trips.
At the plant level, the first sign is inverter ground-fault detection and trip — at which point the inverter is offline and producing zero. At the string level, insulation resistance monitoring catches the developing fault hours or days before it triggers the inverter protection, allowing scheduled isolation instead of forced shutdown during peak production.
What Serious String-Level Fault Detection Looks Like
The principle is straightforward: at any given moment, every string in a peer group — same orientation, same tilt, same panel model, same MPPT tracker, same electrical context — should produce approximately the same DC current under the same irradiance and temperature. When one string consistently produces less than its peers under the same conditions, that is the fault signal worth investigating.
Translating that principle into a detection system that operators will trust requires getting four things right:
- Peer-group definition. A string is only fairly compared against its actual cohort — same orientation, same hardware, same electrical environment. A platform that compares strings across mismatched cohorts will generate a wall of false alarms and the operators will turn off the alerts.
- Self-calibration against weather conditions. Comparing absolute string output against a fixed threshold fires false alarms every cloudy day. Comparing against the cohort median self-calibrates: a cloudy day depresses every string in the peer group together, so the ratios stay stable.
- Time-of-day and seasonal awareness. Sibling-current ratios are noisier in low-irradiance hours (early morning, late afternoon, overcast days) than in mid-day. A serious detection system treats those regimes differently and avoids firing alarms on noise.
- Persistence filtering and severity scoring. A single anomalous reading is noise. A string sustaining underperformance over a meaningful window is signal. The alert system has to distinguish the two and route only the persistent, material deviations into the O&M ticket queue.
A well-tuned detection layer surfaces the strings that need attention without burying the operators in noise. A poorly-tuned one is worse than nothing — operators learn to ignore the alerts and miss the real ones in the flood.
Why Time-of-Day Awareness Matters
Sibling current ratios are not stationary across the day. Low-irradiance hours (sunrise, sunset, cloudy mornings) amplify measurement noise and partial-shading effects from horizon objects, producing wider natural variation between siblings even on healthy strings. Mid-day under full irradiance produces the tightest sibling agreement and the lowest noise floor.
A detection system that ignores this and applies the same deviation threshold across all hours either (a) suppresses real mid-day faults by setting the threshold permissively enough for noisy morning hours, or (b) generates false alarms every morning by setting the threshold tight enough for mid-day. Neither is acceptable. The serious approach derives different sensitivity profiles for each regime from the rolling distribution of normal-condition behaviour, refreshed as the seasons change.
Revenue Impact: The Math on One Failed String
Consider a typical 5 MW plant with 400 strings, average annual specific yield 1,450 kWh/kWp, and an average revenue capture of €72/MWh across day-ahead and PPA mix.
- Per-string nominal annual production: 5,000 kW ÷ 400 strings × 1,450 kWh/kWp = 18,125 kWh/year/string
- Per-string nominal annual revenue: 18.1 MWh × €72/MWh = €1,305/year/string
A single string operating at 80% of its peer median for a full year loses:
- 20% × 18,125 kWh = 3,625 kWh of lost generation
- 20% × €1,305 = €261/year of lost revenue per string
A plant with 5 strings in this condition is losing €1,300/year. A plant with 20 strings in this condition (5% of the plant — still invisible at the PR level) is losing €5,200/year. Over a 25-year plant lifetime, that 5% becomes €130,000 of lost revenue per plant — and that is the minimum, because the same fault modes that cause string underperformance tend to accelerate over time if not addressed.
The cost of string-level monitoring infrastructure (the additional telemetry, the SCADA platform, the alert workflow) amortises against this loss budget many times over. The break-even is typically met by the second flagged-and-fixed string per plant per year.
Implementation: What Data You Actually Need
The minimum data set required for credible string-level monitoring:
- Per-string DC current and voltage at the combiner or MPPT input
- Per-inverter AC power, frequency, power factor for cross-validation
- Peer-group metadata — which strings feed which MPPT input on which inverter, orientation, tilt, panel model
- Site weather data — plane-of-array irradiance and module temperature from at least one calibrated station per block
- Time-synchronised polling at a cadence fast enough to distinguish fast transients from persistent faults
If the inverter manufacturer's data layer (FusionSolar, SmartLogger, EZSCAN, Sunny Portal, etc.) exposes per-string current — most modern Tier-1 inverters do via Modbus TCP register maps — the data is already there. The platform's job is to poll it, normalise it across vendor variants, and run the comparison logic.
Common False-Positive Traps
Real-world detection systems contend with several recurring patterns that look like string faults but aren't, and which a mature platform suppresses or re-classifies appropriately:
- Mechanical tracker misalignment — a tracker that is mechanically stuck or misaligned shows the strings on that tracker as consistently low vs siblings on properly-tracking peers. This is a real fault, but it is mechanical, not electrical, and the O&M response is different.
- Combiner-level fuse failure — one bay of strings going to zero looks like a fault on every string in that bay. The pattern (all strings in the same bay drop simultaneously) is distinctive and should not be confused with per-string faults.
- Shadow from infrastructure — a new building, a grown-tall tree, or even a temporary site vehicle parked next to a row of panels creates consistent low readings for affected strings during specific time windows. The detection system has to be aware of site geometry.
- Inverter operating-point clipping — when the inverter is voltage-clipping (DC voltage above the MPPT range), all strings on the affected MPPT input may show lower current than siblings on a different MPPT — not a string fault, an inverter operating-point issue.
- Power curtailment — when the plant is curtailed by the TSO or by the dispatch optimiser, strings appear under-performing relative to model — not a fault, an explicit instruction. The detection system must be aware of curtailment commands.
A mature alert system tags each of these patterns and de-prioritises (or suppresses) the alerts they generate, keeping the alert queue focused on the actual diagnostic-worthy events.
Frequently Asked Questions
Conclusion
Plant-level KPIs are the right summary for stakeholders. They are the wrong tool for finding what is actually going wrong. The plants that operate above their guaranteed PR over the long term are not the plants with the best monthly numbers — they are the plants where every string is being watched, every flagged anomaly is being investigated, and the small losses are being caught and fixed before they compound into the large losses that show up in the year-end reconciliation.
DYNVOLT's SCADA module polls every string via Modbus TCP and runs peer-comparison and time-of-day-calibrated deviation analysis, surfacing the flagged strings as severity-scored tickets into the O&M workflow. See the SCADA module for the architecture, the operations module for the ticketing layer, or request a 14-day pilot and we will surface the underperforming strings on your plant in the first review call.