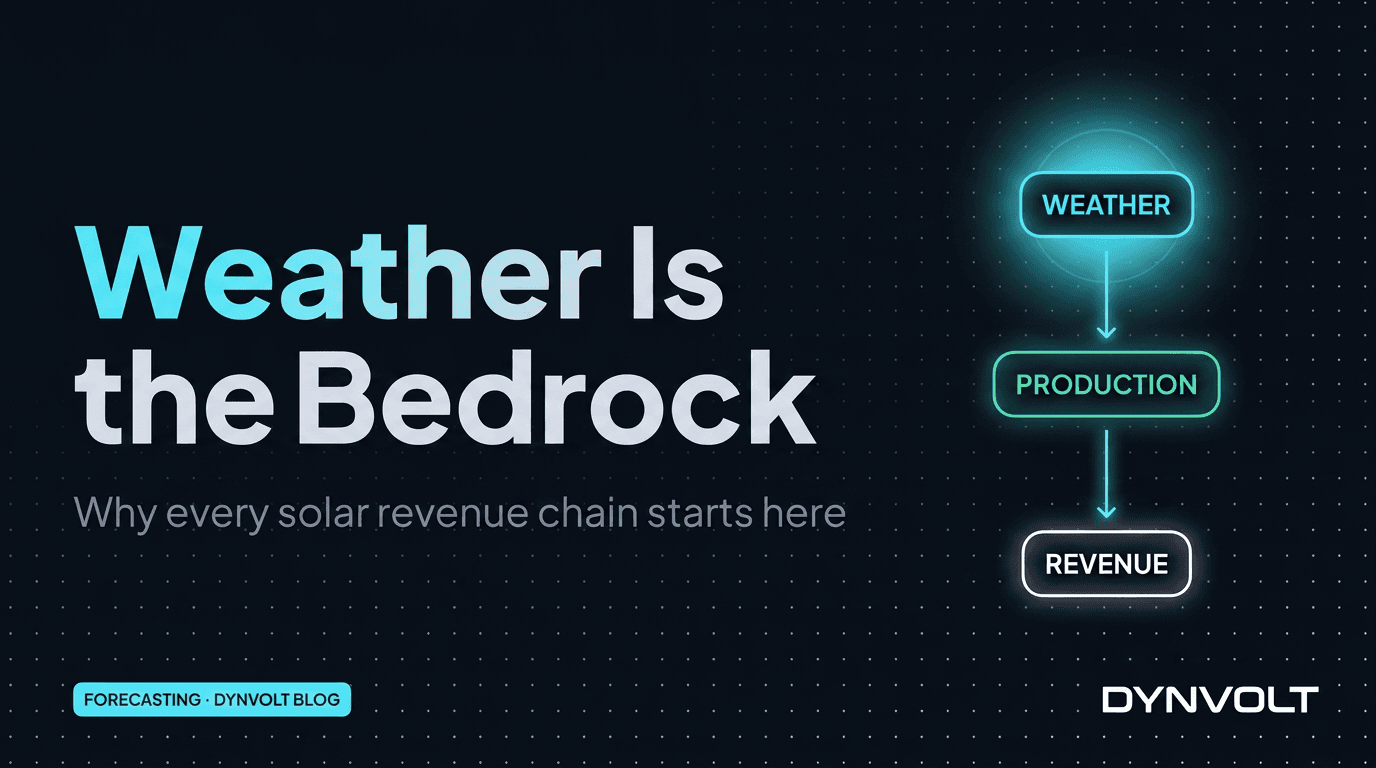
Every monetary outcome at a solar plant traces back to one number: tomorrow's irradiance. The day-ahead bid is built from a production forecast that is built from a weather forecast. The intraday rebalance is triggered by a weather observation. The BESS dispatch plan is conditioned on a cloud-cover forecast. The lender's quarterly performance ratio reconciliation depends on the weather-adjusted theoretical yield, which depends on the historical irradiance record. The PPA settlement, the warranty argument, the curtailment dispute — every commercially-consequential conversation about a solar plant eventually arrives at the meteorological data layer.
Yet weather forecasting is the layer that gets the least attention in most procurement decisions. Plant owners spec the inverter brand to three decimal places, agonise over the SCADA platform, write 40-page RFPs for the EPC contract — and then plug a single weather API into the dispatch system and consider weather "handled." This guide explains why that approach loses money, what a serious weather-data layer looks like for utility-scale solar, and how to think about the trade-offs between consumer-grade APIs, multi-source ensembles, and the site-specific calibration that turns either one into a bid-quality forecast.
- Every commercial outcome at a solar plant — DAM bid, intraday rebalance, BESS dispatch, PR reconciliation — traces back to the weather data layer; weather is the hidden upstream variable in every revenue equation.
- Single-source weather APIs trade ease of integration for structural model bias — fine for prototypes, costly for production trading.
- Multi-source ensembles materially reduce day-ahead irradiance forecast variance versus relying on any one weather model alone.
- Raw irradiance forecasts are not power forecasts — plane-of-array conversion, cell-temperature modelling, and soiling adjustment turn weather into bid-quality production estimates.
- On-site weather stations are the third leg — they ground the forecast against measured local conditions and catch the rapid divergences that pure forecast feeds miss.
- A solar plant operating without proper weather-data infrastructure is essentially trading and dispatching blind during the windows that matter most: front passages, convective events, and seasonal regime shifts.
Every Revenue Chain Starts With Weather
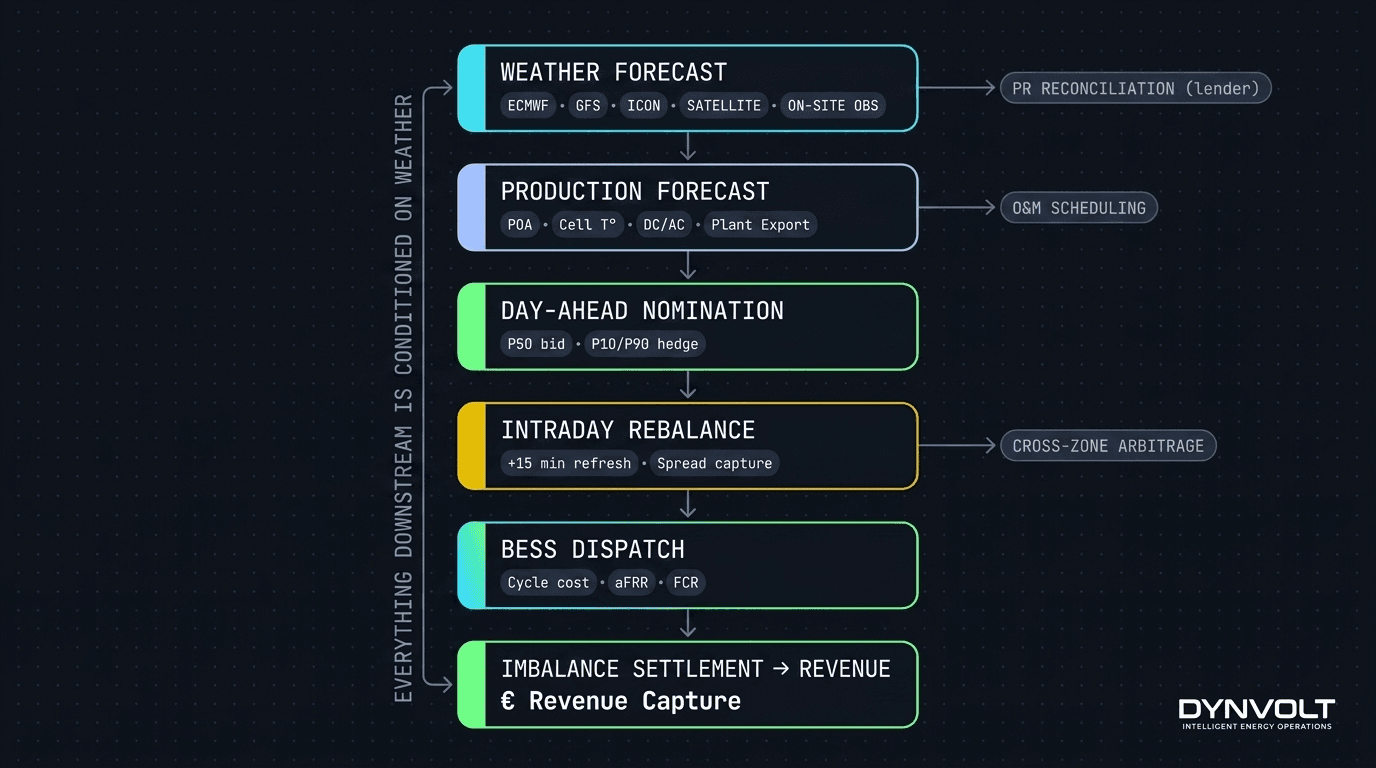
The five commercial workflows at a utility-scale solar plant share a single first input: the weather forecast.
| Workflow | Direct weather dependency | Failure mode if weather is wrong |
|---|---|---|
| Day-ahead bid construction | Hourly irradiance + temperature for D+1 | Over- or under-nominated → imbalance penalty |
| Intraday rebalance | 1–4 hour rolling forecast revisions | Missed mean-reversion / forecast-revision arbitrage |
| BESS dispatch optimisation | Production forecast for next 24 h informs charge/discharge windows | Sub-optimal cycle allocation, missed peak windows |
| O&M scheduling | 3–7 day forecast for low-yield days | Maintenance scheduled on high-revenue days |
| Lender / insurer PR reconciliation | Historical irradiance against panel datasheet | Disputed guarantee claims, deferred payments |
The first four are real-time. The fifth is the reason historical weather data is part of the asset record. Together they explain why the weather data layer is operationally and contractually load-bearing for any plant above tinker-scale.
The Weather Data Stack — What Utility-Scale Plants Actually Use
Three layers of weather data feed a production solar plant:
Layer 1 — Forecast sources
The upstream forecast comes from Numerical Weather Prediction (NWP) models run on national meteorological service supercomputers. A handful of them dominate European solar forecasting:
- ECMWF (IFS) — European Centre for Medium-Range Weather Forecasts. The most accurate single global model for medium-range forecasting in Europe.
- GFS — NOAA (US). Wide coverage, frequent refresh, useful complement.
- ICON — DWD (Germany). Strong over Central and Eastern Europe.
Each model carries persistent structural bias. Some tend to under-forecast summer convective cloud development; others over-smooth cloud fields in mountainous terrain; others have known issues with coastal moisture. These biases are documented in the meteorological literature and do not go away with model version updates.
Layer 2 — Aggregator APIs (consumer-grade)
A second tier of providers takes one or more NWP feeds, applies their own post-processing (often including a proprietary cloud-cover or irradiance model), and exposes the result through a clean REST API:
| Provider | Underlying models | Typical use | Cost |
|---|---|---|---|
| Solcast | ECMWF + proprietary satellite-derived nowcast | Day-ahead PV forecasting at API scale | Subscription (per-site or per-API-call) |
| OpenWeatherMap | GFS + ECMWF blended | General-purpose weather data | Free tier + paid plans |
| Open-Meteo | ECMWF + GFS + ICON + others (configurable) | Open-source, no API key required | Free for non-commercial / paid for commercial |
| Visual Crossing | Multi-source blend | Mixed commercial use | Per-call pricing |
| Meteomatics | Configurable per-source | Enterprise / scientific | Enterprise contract |
Aggregator APIs are wonderful for prototyping a dashboard, validating a hypothesis, or running a forecast on a single small plant. They become the wrong choice when:
- The volume of forecast requests outpaces the API's commercial tier
- The plant's location is outside the provider's strongest accuracy zone
- The required forecast horizon exceeds the API's coverage
- The trading desk needs raw weather outputs for custom ensemble blending — most aggregators expose only their pre-processed single output
Layer 3 — Site instruments
The third leg of a serious weather stack is on-site measurement. The standard utility-scale instrumentation:
- Pyranometer for global horizontal irradiance (GHI)
- Plane-of-array (POA) pyranometer — irradiance in the plane of the actual panel surface
- Module-back temperature sensor for cell-temperature derating
- Ambient temperature and humidity for the POA-to-cell temperature model
- Wind speed and direction at hub height
- Soiling station — paired clean + dirty reference panels with their own pyranometers
- Rain gauge for soiling-recovery modelling
The role of the site instruments is not to replace the forecast — they cannot forecast — but to anchor the forecast against measured local reality. When the forecast says clear sky and the pyranometer says 750 W/m², the forecast is wrong and the real-time dispatch should lean toward the measurement.
Why One Weather Model Is Dangerous
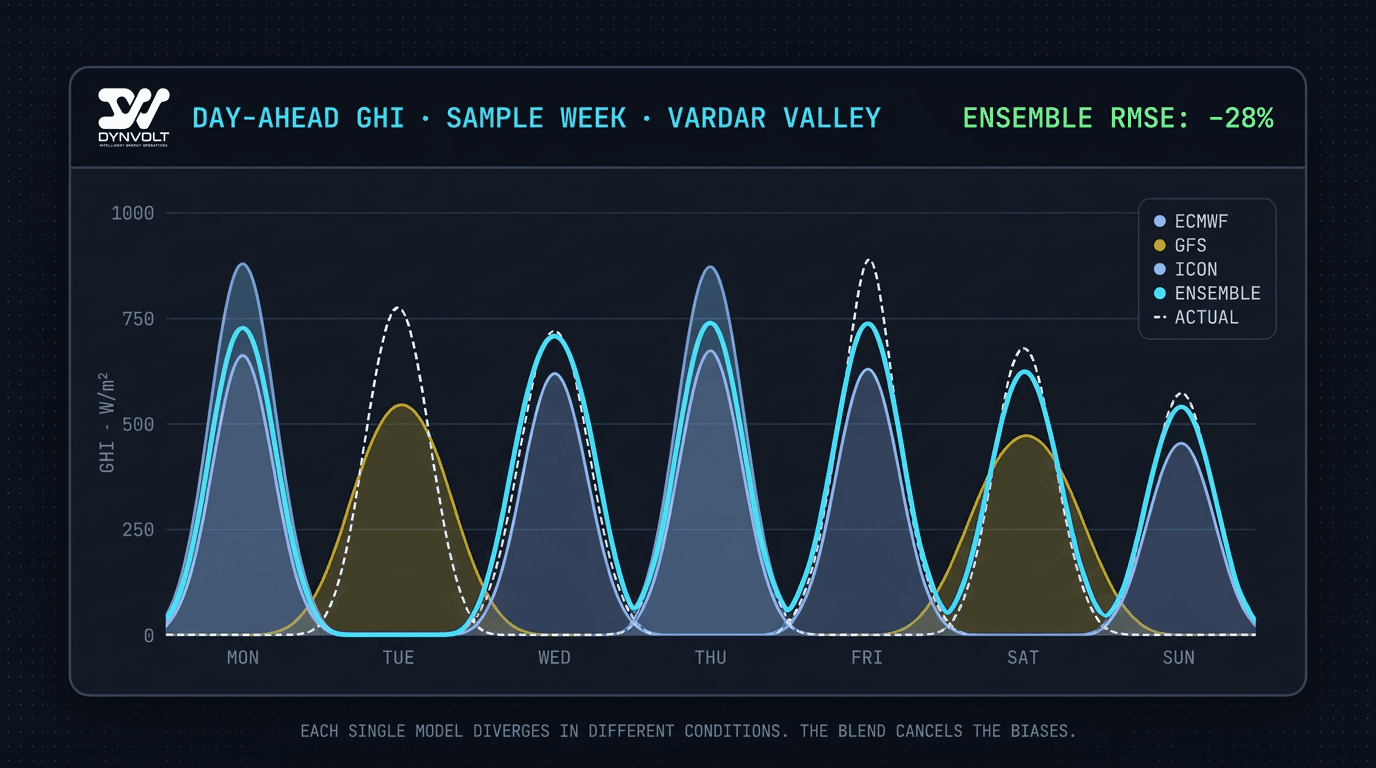
Every weather model has a bias surface — locations and conditions where it systematically over- or under-forecasts. The biases are well-documented in the meteorological literature and not removed by model updates. A solar plant operating off a single weather source inherits that source's bias surface in full. On days when the bias works against the operation, the cost shows up in imbalance settlement.
The well-established correction is ensembling — blending the outputs of multiple weather models, weighted by historical skill at the plant's specific location and the current weather regime. Published benchmarks across European solar sites show ensemble fusion reducing day-ahead irradiance forecast variance by a meaningful double-digit percentage versus the best single member.
The simplest version — a flat average across two or three models — already captures most of the gain. More sophisticated implementations weight each contribution based on site geography, forecast horizon, current weather regime, and rolling skill scores. The bottom line for an asset owner evaluating a forecasting platform: ask which sources feed the forecast, not which single source. A vendor whose entire forecast traces back to one weather feed is shipping that feed's bias to your trading desk.
The blended ensemble is the production-grade input for solar production forecasting. It is the cost-effective starting point for any platform that takes its forecast accuracy claim seriously.
Irradiance Is Not Power: Why Site-Specific Calibration Matters
A perfect irradiance forecast is still not a production forecast. The conversion from "1042 W/m² of GHI" to "16.3 MWh of AC output" runs through five distinct calculation layers, each of which can introduce error:
1. GHI → POA
Global horizontal irradiance is what hits a flat surface. Solar panels are tilted, often tracked, and oriented in specific azimuths. The plane-of-array calculation projects GHI onto the panel surface using panel tilt, azimuth, sun position, diffuse vs direct decomposition, ground albedo, and inter-row shading.
A fixed-tilt plant at 35° south-facing in Skopje on a summer afternoon has POA that diverges from GHI by 15–30%. A single-axis tracker following the sun has POA that exceeds GHI by 25–40% at mid-day. Forecasts that skip the POA step lose this entire conversion accuracy.
2. POA → Cell temperature
Cell temperature is not ambient temperature. The standard model relates them via POA, ambient temperature, wind speed, and a panel-specific nominal operating cell temperature (NOCT) parameter. Cell temperature drives the panel temperature coefficient (typically −0.34 to −0.40 %/°C for c-Si) which can shift output by 5–8% between cool and hot days at the same irradiance.
3. Cell temperature → DC power
The single-diode model translates POA and cell temperature into per-string DC power using the panel I-V curve and datasheet parameters, adjusted for soiling, spectral effects, light-induced degradation, and cumulative degradation.
4. DC power → AC power
The inverter efficiency curve, clipping behaviour, and reactive power dispatch all reshape the DC output into AC output. DC/AC ratios above 1.0 (modern PV plants overbuild DC by 1.15–1.35× nominal) mean the inverter clips during the highest-irradiance hours.
5. AC power → Plant export
Transformer losses, AC cable losses to the point of common coupling, auxiliary loads, and grid-code curtailment commands all reduce gross AC into final delivered energy.
The accumulated impact: an irradiance forecast that is 5% wrong at the GHI level can be 12–18% wrong at the plant-export level once all five layers compound, if the calibration of those layers is itself off. A platform that handles all five layers with site-specific calibration is the difference between bid-quality and demonstration-quality forecasting.
The Forecast Lifecycle: Refresh Cadence
Weather data is not static. Forecasts refresh; observations stream. The principles that matter for a dispatch layer:
- Upstream weather model runs refresh several times per day. The run that arrives shortly before SDAC gate closure is the most operationally important for day-ahead bidding.
- Satellite-derived nowcasts refresh much faster than NWP and are critical for short-horizon (0–4 hour) intraday rebalancing where NWP is too slow to react.
- On-site weather observations stream continuously and provide the ground truth that anchors the forecast against measured local conditions.
- Production forecasts that consume these inputs should recompute frequently during the trading day and at least every few hours overnight — anything slower drifts and trades on stale data.
The dispatch layer that consumes a forecast hours after the latest input refresh is making decisions on stale data — the equivalent of trading off yesterday's news.
What Happens Without Good Weather Data
The failure modes in a poorly-instrumented or poorly-modelled plant manifest predictably:
- Front-passage misses — the day a low-pressure front arrives mid-morning is the day the previous evening's forecast was wrong. Plants without intraday weather refresh bid through the disaster.
- Convective initiation — summer afternoon thunderstorms develop on 1–3 hour timescales. Forecasts without nowcast input miss them; satellite-fed forecasts catch them. Plants without nowcast input over-nominate every summer afternoon.
- Soiling drift — a plant without a soiling station applies an average soiling assumption that is wrong half the year. The PR reconciliation against the lender becomes a recurring argument.
- Tracker control errors — single-axis trackers that don't account for diffuse-fraction-driven backtracking opportunities (overcast days where flat orientation can outperform tracked) lose 1–3% annually.
- Cell-temperature mis-modelling — plants using ambient temperature instead of properly-modelled cell temperature systematically over-forecast hot-day production by 4–7%.
All of these are solvable. None of them are solved by an API key alone.
Frequently Asked Questions
Conclusion
Weather is not "handled" by an API key. It is a stacked data infrastructure — multi-source forecasting, satellite nowcasting for the intraday horizon, on-site instruments for the ground truth, and a calibrated site-specific model for the conversion from irradiance to power — and every layer is load-bearing for the commercial outcomes downstream. The plants and trading desks that take weather seriously make money on the days the plants that don't take weather seriously lose it.
DYNVOLT's forecasting module covers the layers end-to-end and feeds the result through a per-block plant-signature model with full POA / cell-temperature / DC-AC modelling. See the forecasting module, the day-ahead bidding playbook for how the forecasts feed the trading desk, or request a 14-day pilot to compare your current weather-data layer against ours.