Battery revenue study
Battery revenue study from your site's own data
What would a battery earn at your site? Upload a year of meter data. A deterministic dispatch engine runs the battery against real day-ahead prices and the published network tariff for your market, and returns the revenue by stream, the right size, and the assumptions the number rests on.
- 25 European marketsexchange prices, regulator tariffs, versioned
- Five sizes per studyvalue per kWh installed for each
- Every number has a cellevery assumption has a source
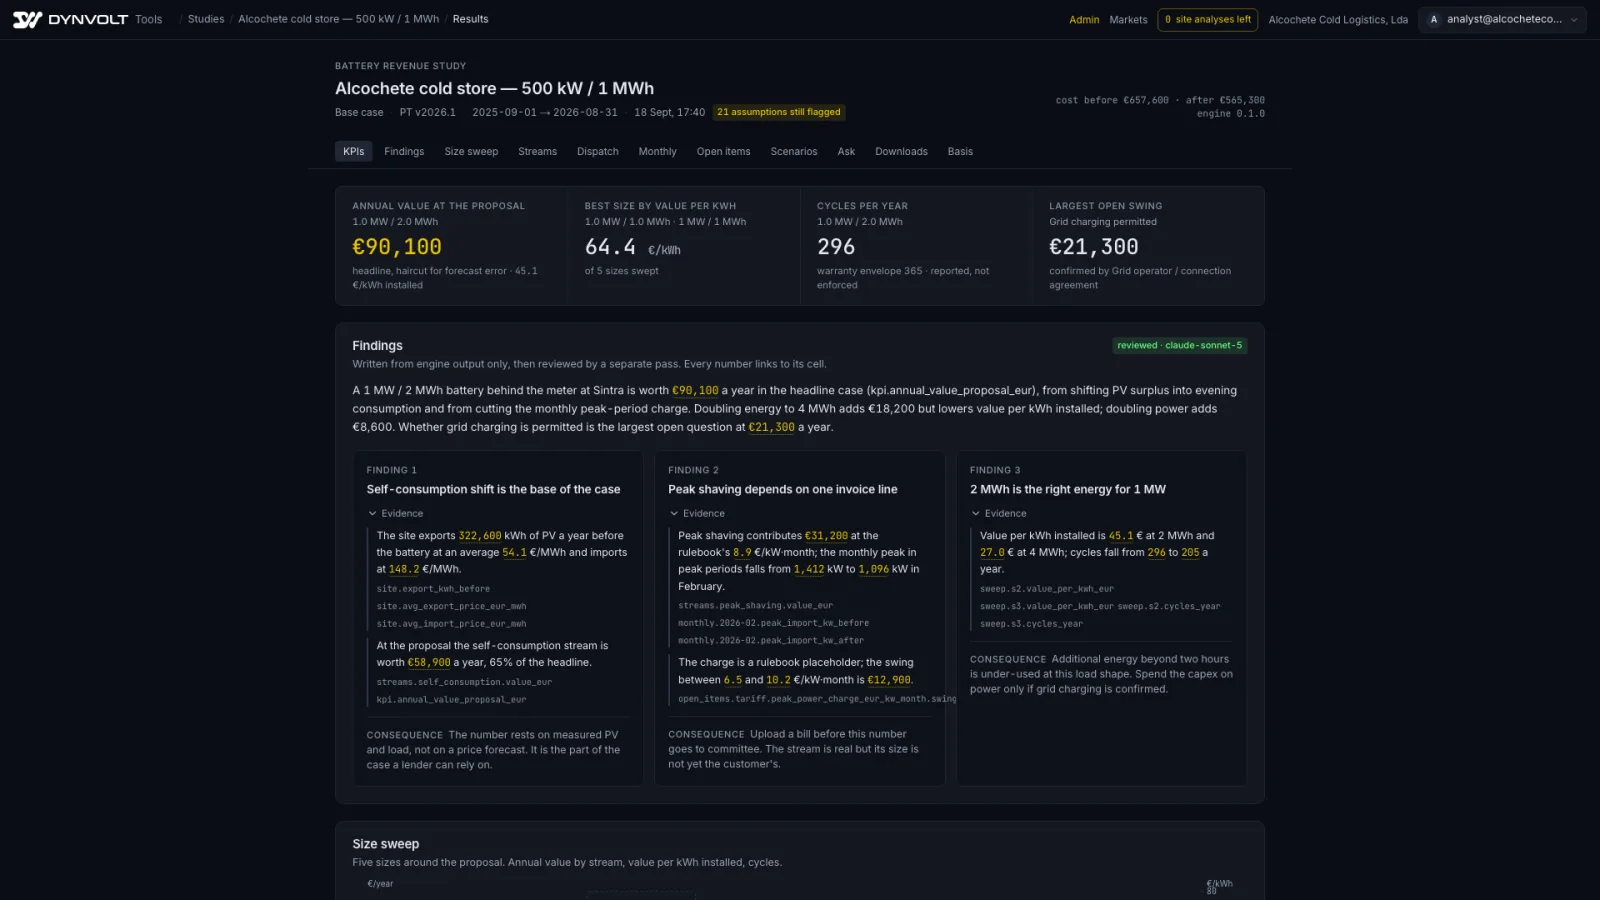
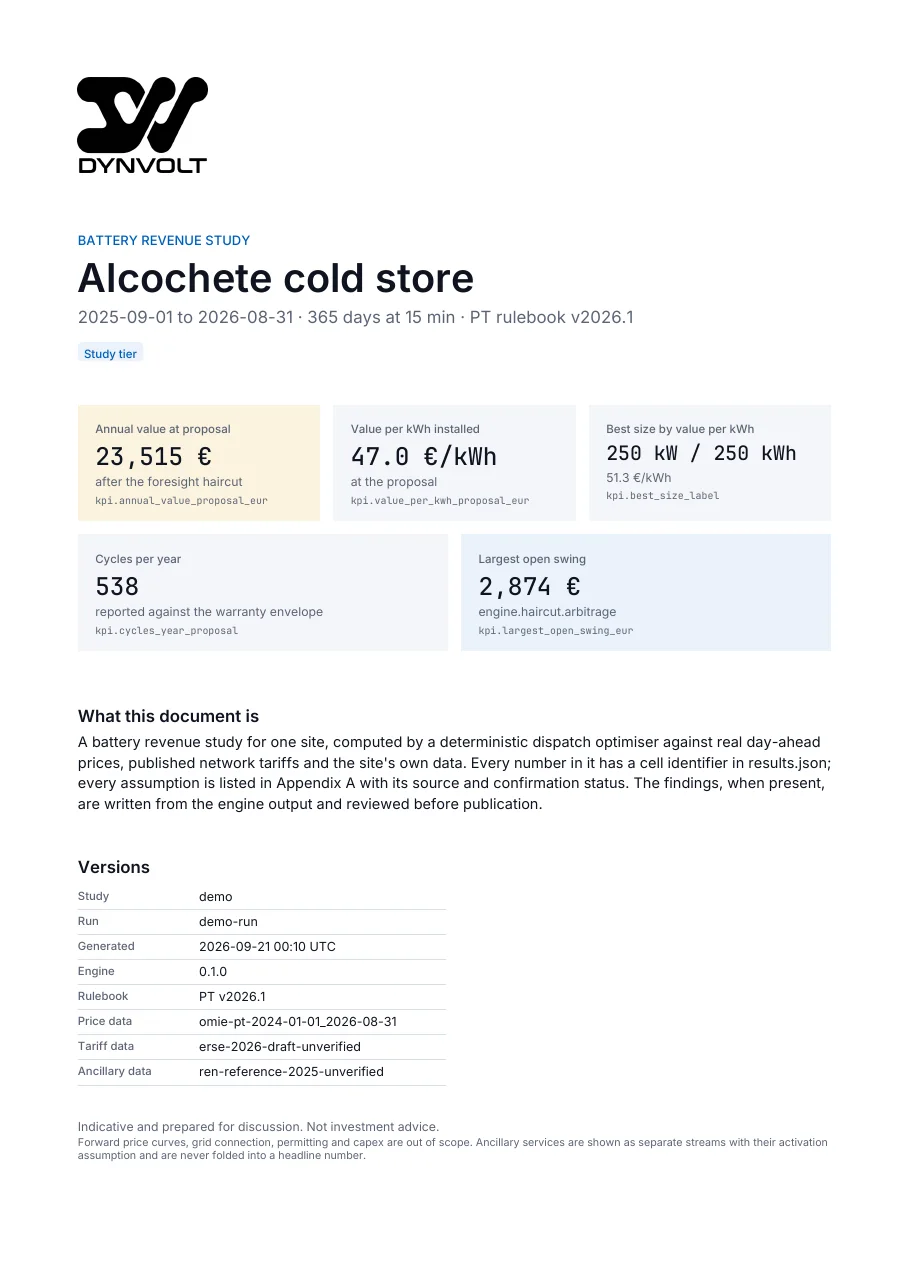
results of a study on a synthetic Portuguese C&I site (demo data)
Three things a committee asks for
What you get
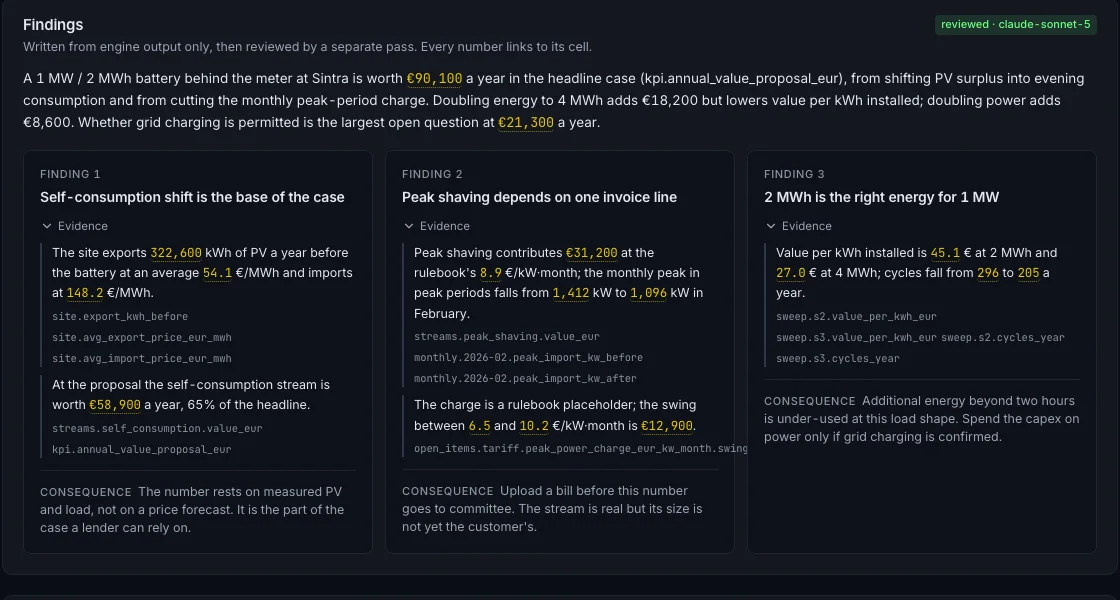
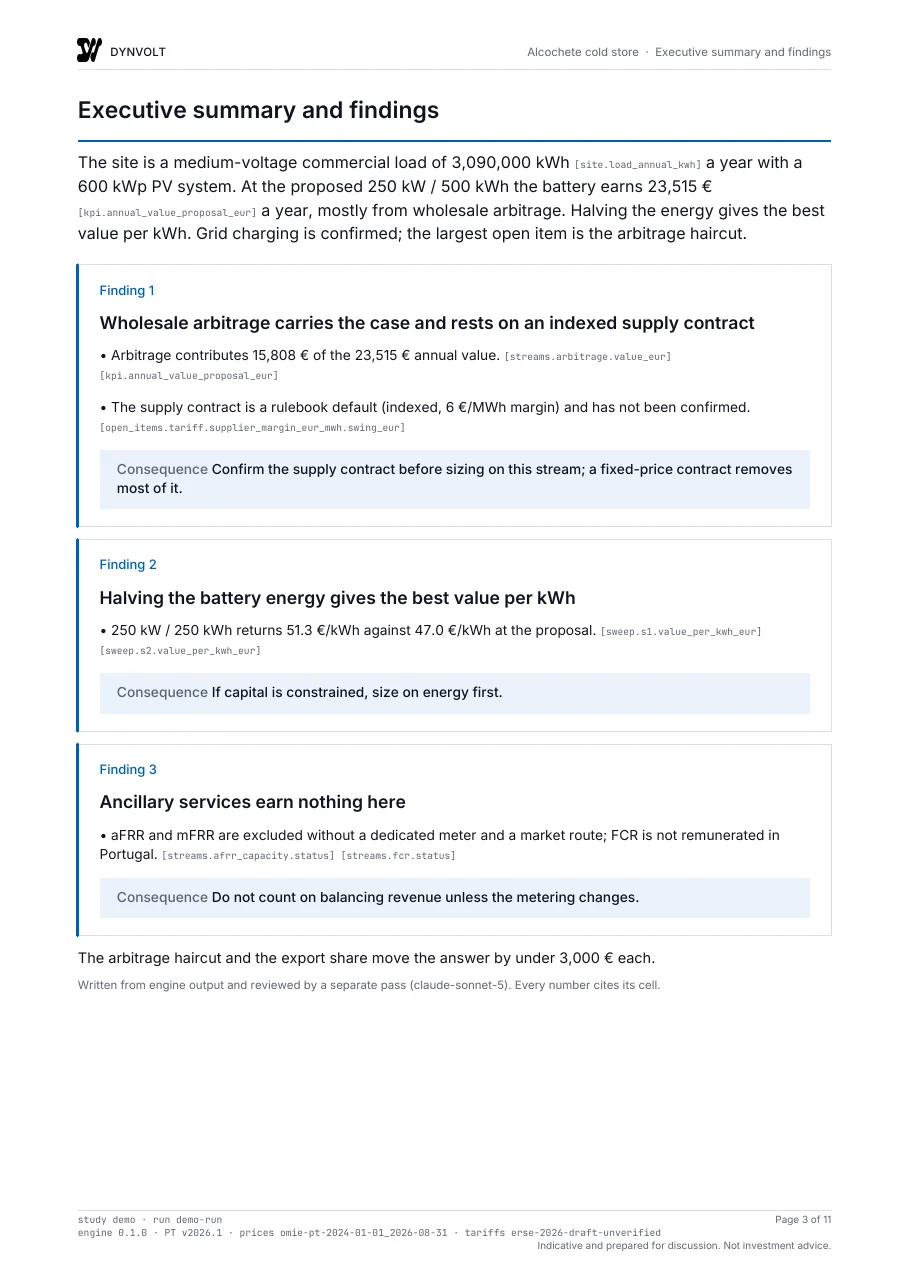
Findings with the evidence attached
Three findings written from the engine output and reviewed by a second pass. Every number in them links to the cell it comes from, so the reader can check the claim without opening the workbook.
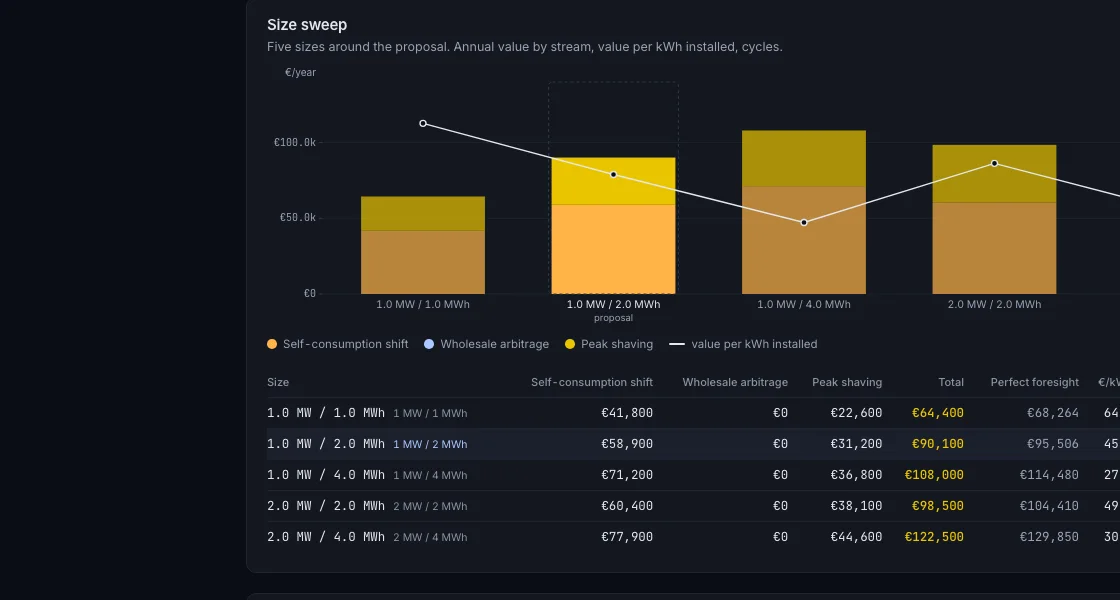
Five sizes, every stream
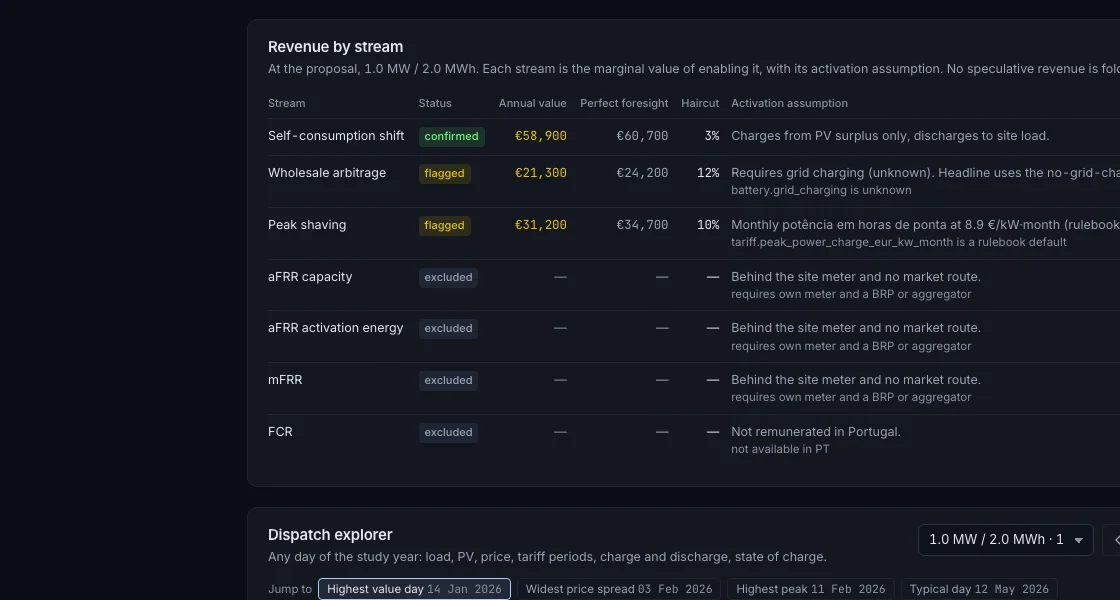
The engine sweeps five battery sizes around your proposal and values each revenue stream on its own: self-consumption, arbitrage, peak shaving, and aFRR or mFRR where the site can reach them. A stream that depends on an unconfirmed assumption is shown flagged, not folded into the headline.
The dispatch, any day of the year
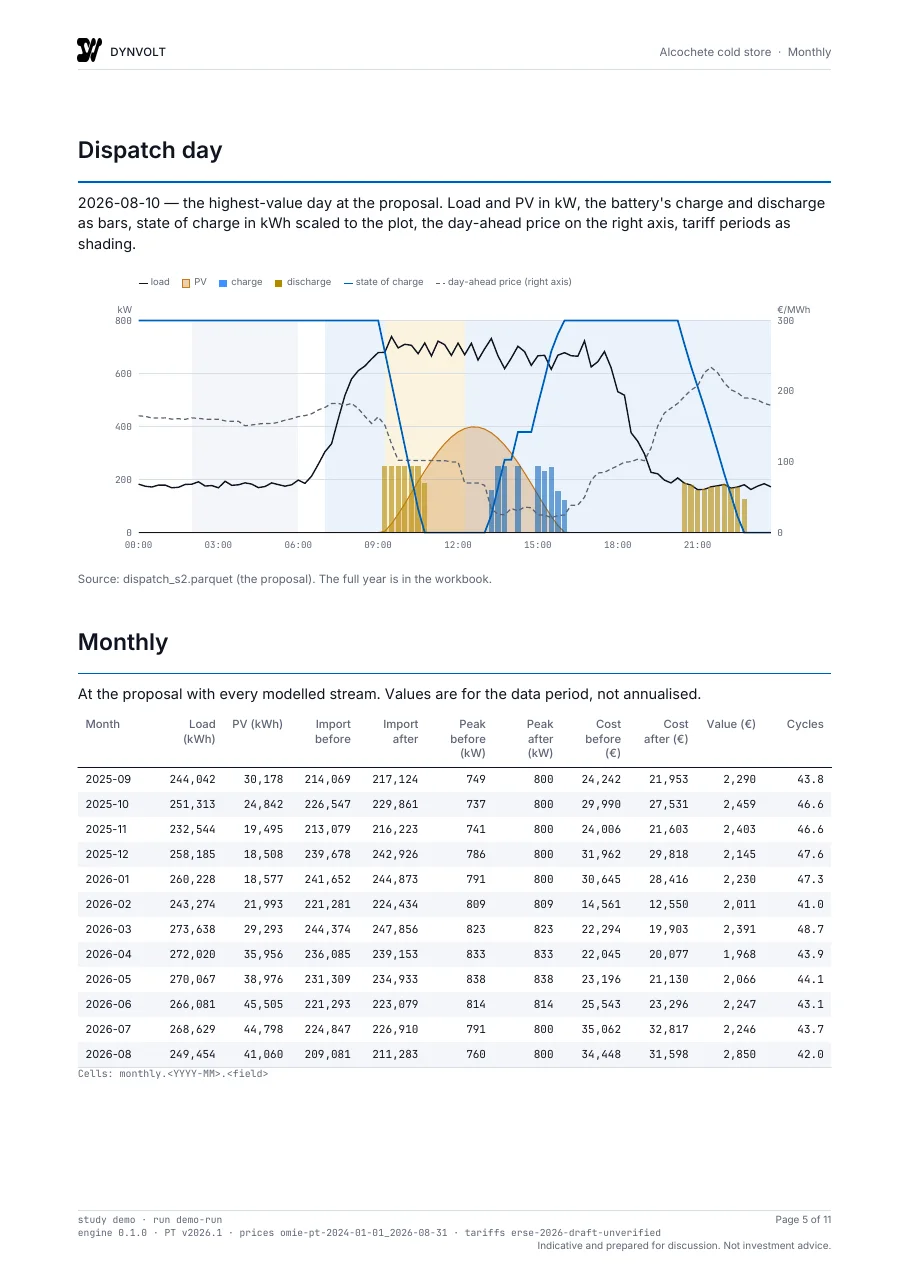
Pick a day and see load, PV, price, tariff periods, charge, discharge and state of charge at the market's settlement interval. It is the screen an engineer uses to decide whether to believe the annual number.
From a meter export to findings
How a study is produced
- 01
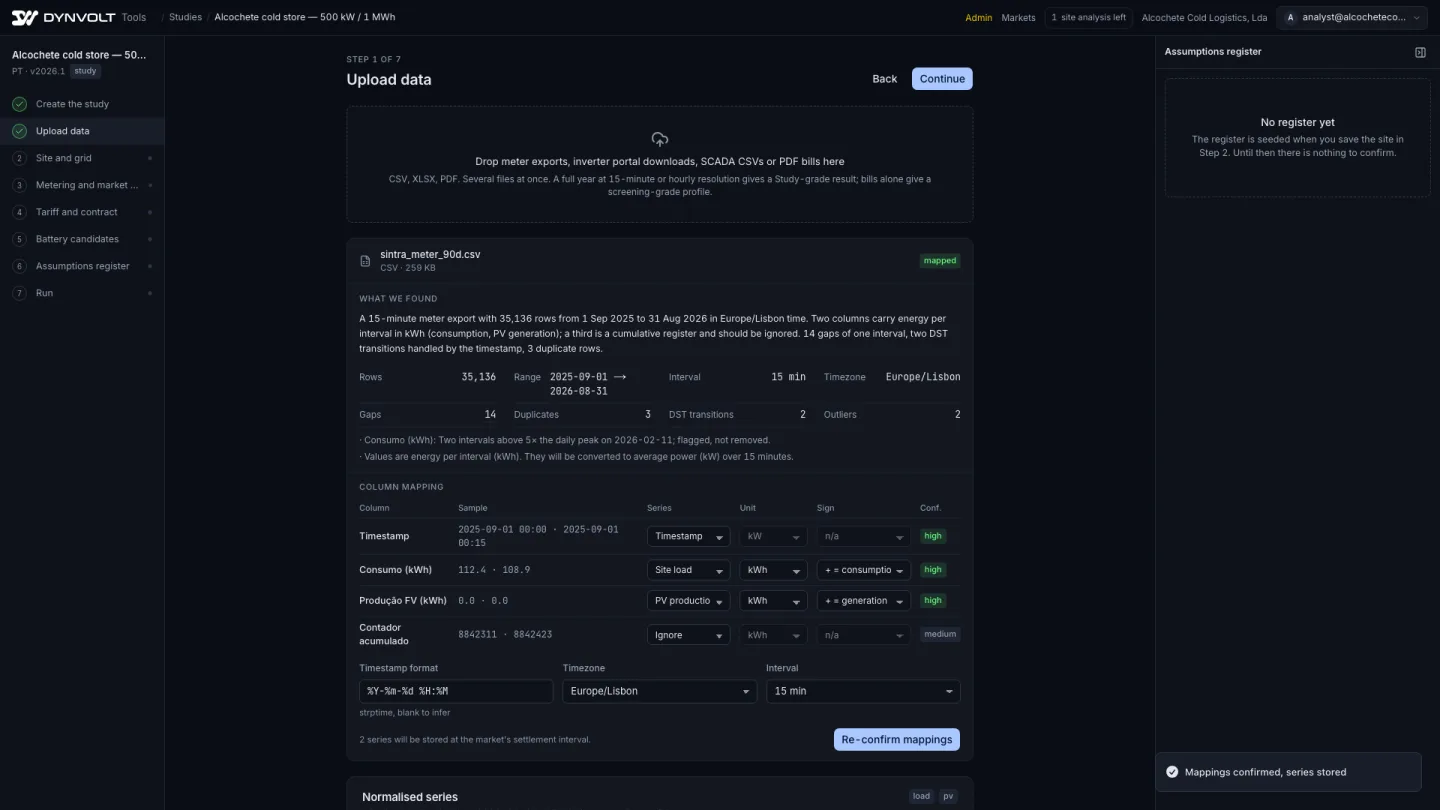
Upload the site's data
Meter exports, inverter portal downloads, SCADA files or PDF bills. An ingestion agent reads the file, reports rows, interval, timezone, gaps and daylight-saving transitions, and proposes what each column is. Nothing is modelled until you confirm the mapping.
- 02
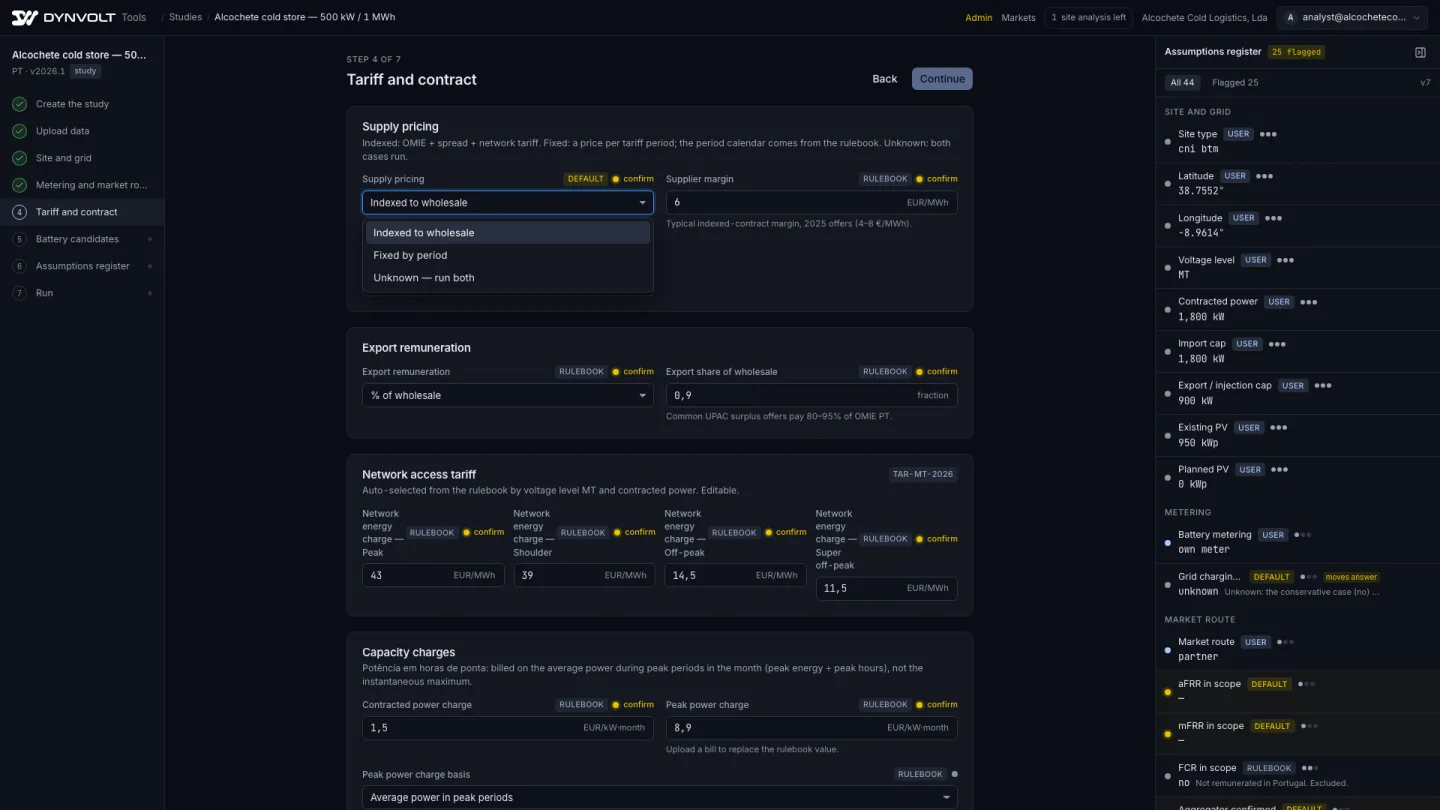
Describe the site and the contract
Location, connection, import cap, export permission, metering, market route, supply pricing and export remuneration. The network tariff and the balancing products come from the market's rulebook. You can override any of them.
- 03
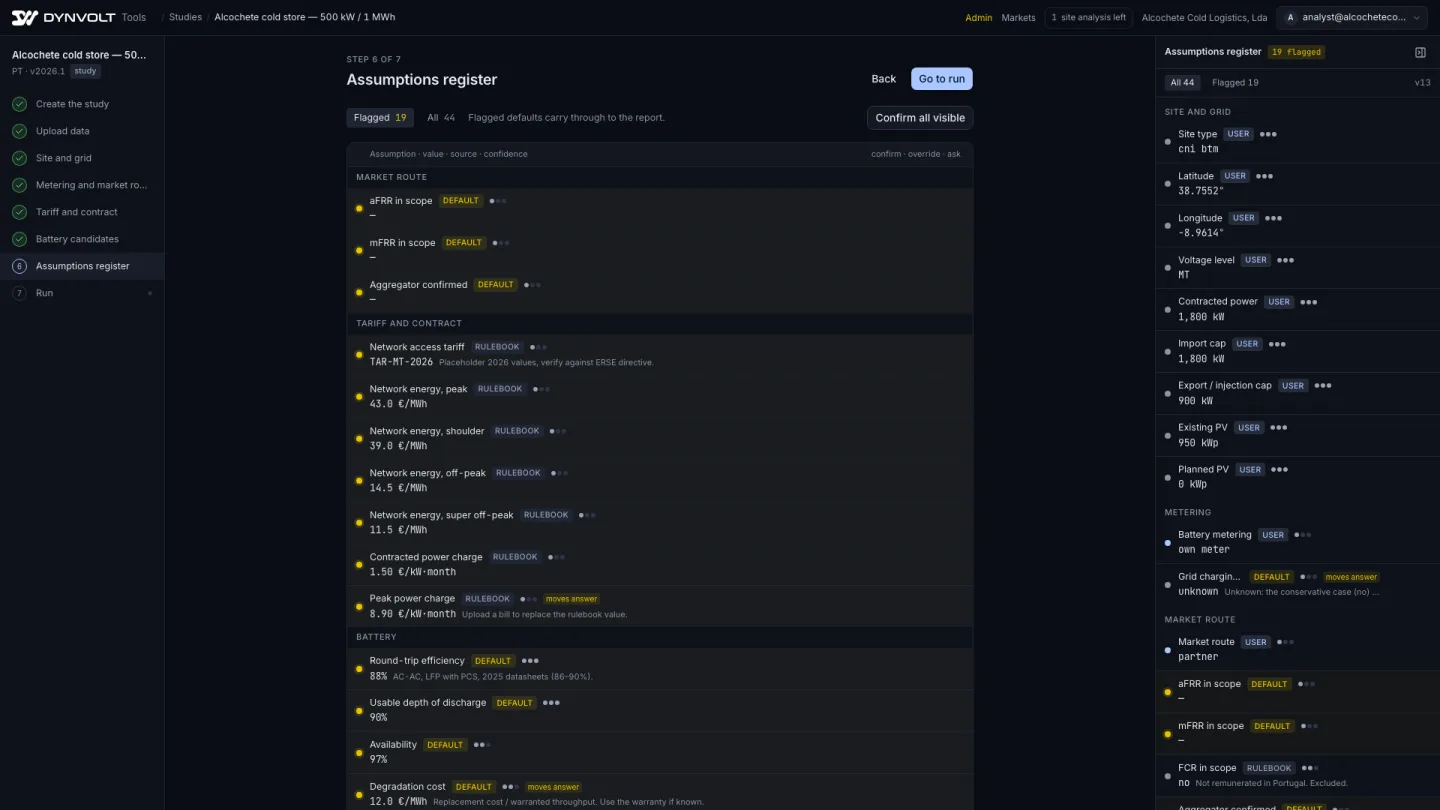
Review the assumptions register
Every value the engine will use has a row with its source, its confidence and whether you confirmed it. Defaults stay flagged until you touch them, and a study run with flagged defaults says so in the report.
- 04
Run and read the findings
The engine solves a linear programme for every day of the year, for five sizes, enabling one stream at a time. Findings are written from the output and reviewed. Change one assumption and re-run; scenarios sit side by side.
Nine minutes, one site
See a study built from start to finish
A recorded run on a synthetic Portuguese commercial site: upload, register, run, results, downloads. Narrated, with captions.
Built for the reader who checks
Every number has a cell
A study is only useful if the person reading it can trace the number. Every KPI, finding and chart in a DYNVOLT study carries the identifier of the cell it came from in the results file, and the assumptions register lists every input with its source, its confidence and its confirmation status.
The report is written for that reader: findings with evidence, the size sweep, revenue by stream with the status of each stream, the dispatch for a typical and a peak day, the open items with their euro swing, and the basis and limitations stated plainly. A method card with the engine, rulebook, price-data and tariff-data versions ships with every study.
- Deterministic engine
- Same inputs, same answer, every time. No forecast model inside the loop.
- Real prices and tariffs
- Day-ahead prices from the exchange, network tariffs from the regulator, pinned to a rulebook version with source and retrieval date.
- Foresight haircut
- Arbitrage value is reduced for forecast error, and the haircut is stated as a cell.
- Out of scope, stated
- Grid connection, permitting, capex financing and forward prices are not modelled, and every report says so.
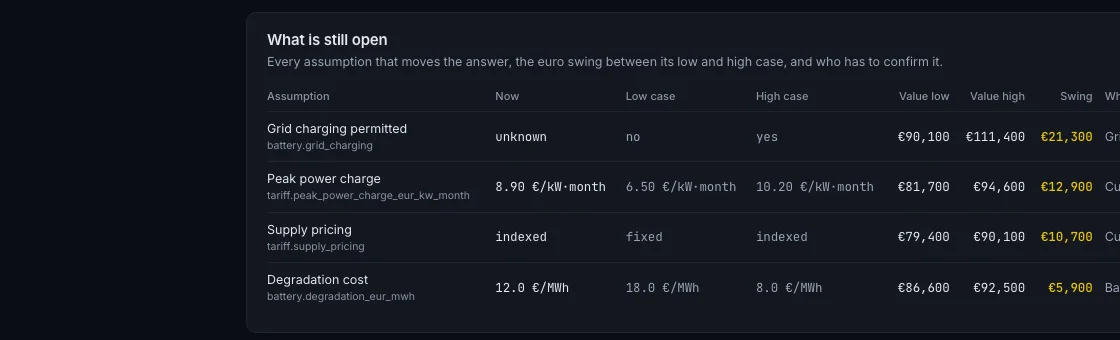
the open items: every assumption that moves the answer, its euro swing and who confirms it
Twenty-five markets ready
Markets
Each market is a rulebook: exchange day-ahead prices, the regulator's network tariffs and tariff periods, and the transmission operator's balancing products, each with its source and retrieval date, pinned to a version. Studies run in euro. A market not listed here can be loaded on request; it takes a few days.
Spain and Portugal first: the rulebooks carry the Spanish 6.1TD peak-power term and the Portuguese ponta, cheia and vazio periods, so peak shaving is sized against the tariff the site actually pays.
- PTPortugal
- ESSpain
- FRFrance
- ITItaly
- DEGermany
- LULuxembourg
- NLNetherlands
- BEBelgium
- ATAustria
- CHSwitzerland
- GBUnited Kingdom
- IEIreland
- FIFinland
- SESweden
- NONorway
- EEEstonia
- LTLithuania
- CZCzechia
- SKSlovakia
- HUHungary
- RORomania
- BGBulgaria
- HRCroatia
- SISlovenia
- MKNorth Macedonia
- more on request
Read one before you order one
Download the sample report
An eleven-page study on a synthetic Portuguese cold-storage site: KPIs, findings with evidence, size sweep, revenue by stream, dispatch days, open items, basis and limitations, and the assumptions register as an appendix. The method card comes with it. Enter a work email and both PDFs are sent to you, with a link to open them now.
Per site, in euro, excluding VAT
Pricing
Pay-as-you-go
One site, taken through the full study. Re-runs and scenarios on that site are included for 30 days. PDF report, results workbook, assumptions register, method card and share links.
Request a studyTeam
Five site analyses a month, one market, three seats. Re-runs for the life of the plan. For an origination team screening its own pipeline.
Request a studyPortfolio
Twenty site analyses a month, all markets, fleet screening and white-label reports. For developers and advisers working across several markets.
Request a studyReviewed
A DYNVOLT engineer validates the inputs and the method, signs the method card and walks your lender's adviser through the study. Every assumption must be confirmed before the run.
Request a studyFees are credited in full against a DYNVOLT operating contract signed within twelve months. Every request is approved and invoiced by DYNVOLT; invoices are payable within 14 days. Prices exclude VAT.
Behind the meter
Battery feasibility study for commercial and industrial sites
For a commercial or industrial site, the study is the feasibility stage for a battery behind the meter: whether it pays, at what size, and from which streams, using the site's own load and the tariff it is actually on. Peak shaving is sized against the network's peak-power term, self-consumption against the measured PV surplus, and arbitrage against the day-ahead prices of the study year.
The output is a set of lender-ready inputs, not a promise: a traceable, reproducible number with its assumptions listed, its open items priced, and grid connection, permitting and capex financing stated as out of scope.
Who it is for
Origination analysts
Screen a pipeline of C&I sites with the same method and compare them on value per kWh, not on a rule of thumb.
EPCs and installers
Put a number and its evidence in front of a customer before the proposal, and size the battery the load actually supports.
Asset owners
Decide whether to add storage to a site or a plant, and know which assumption to confirm before committing.
Lenders' technical advisers
Audit the study from the assumptions register and the results file. Every number has a cell; the method card states the versions.
Thirteen questions, answered plainly
Questions
What data do I need?
One year of load at 15-minute or hourly resolution is ideal, plus PV production if the site has it. Ninety days is enough for a screening, and the report says which it is. If there is no metered profile, a planned PV system can be synthesised from satellite irradiance and monthly bills can be turned into a screening-grade profile; both are marked as derived.
How long does a study take?
A run takes under a minute once the data is confirmed. Most users go from upload to findings in one sitting. A Reviewed study is delivered within five working days of the run.
Which revenue streams are modelled?
Self-consumption shift, wholesale arbitrage and peak shaving are modelled for every site. aFRR and mFRR are modelled where the battery has its own meter, reaches the market route, and clears the minimum bid size or has an aggregator confirmed. FCR is included where the market remunerates it. A stream that depends on an unconfirmed assumption is shown flagged and kept out of the headline.
Where do the prices and tariffs come from?
Day-ahead prices from the exchange or from ENTSO-E Transparency for the bidding zone; network tariffs and tariff periods from the national regulator; balancing rules from the transmission operator. Each carries its source and retrieval date in the rulebook and is pinned to a version. A study is pinned to the rulebook version it ran on.
Is it a forecast?
No. The study runs the battery against the prices and tariffs of the study year with perfect foresight, then applies a stated haircut to the arbitrage value for forecast error. It tells you what the battery would have earned. It does not predict what prices will do.
Can I change an assumption and re-run?
Yes. A scenario changes one assumption and re-runs; each result is appended and can be compared side by side. Re-runs on the same site are free within the plan's window.
What do I get as files?
A PDF report, a results workbook with live formulas, the assumptions register as JSON, the results file with every cell, and a method card with the engine, rulebook, price-data and tariff-data versions. Read-only share links with an expiry and an optional password let you hand the results to a client or a lender.
What is not in scope?
Grid connection and its cost, permitting, capex financing and forward price curves. The report states this on its basis page. The Reviewed tier validates inputs and method; it is not a grid connection assessment.
Who sees my data?
Your organisation only. Data is not pooled, sold or used to train any model. Site names can be pseudonymised before any text is sent to a language model. You can export everything and ask for deletion at any time.
Is this a feasibility study?
For a battery behind the meter, yes, at the revenue and sizing stage. It tells you whether a battery pays at this site, at what size and from which streams, with every assumption listed. Grid connection, permitting and capex financing are out of scope and stated as such.
Can a lender's technical adviser use it?
Yes. The adviser gets the results file with a cell behind every number, the assumptions register with source and confidence per row, and the method card with engine, rulebook and data versions. The Reviewed tier adds an engineer's validation, a signed method card and a walkthrough.
Which markets are covered?
Twenty-five European markets are ready: Portugal, Spain, France, Italy, Germany, Luxembourg, the Netherlands, Belgium, Austria, Switzerland, the United Kingdom, Ireland, Finland, Sweden, Norway, Estonia, Lithuania, Czechia, Slovakia, Hungary, Romania, Bulgaria, Croatia, Slovenia and North Macedonia. Any other market with a public day-ahead price and a published network tariff can be loaded on request.
How do I start?
Send the request below. We reply within one working day, approve the request and invoice your company details. Nothing is charged until the request is approved.
Request a study
Start with one site
Tell us about the site and which option fits. We reply within one working day. Every request is approved and invoiced by DYNVOLT before work starts. Your data is used only for your study and deleted on request.
Coverage: the 25 markets above, and any other market with a public day-ahead price and a published network tariff on request.
Studies are indicative and prepared for discussion. They are not investment advice.